The Real Cost of Government Corruption in Los Angeles Homeless Spending
A taxpayer's guide to where Los Angeles housing money actually goes compared to where it was promised to go, explained using the universal language of mortgage payments.
Part 1 - The Question
Every year, Los Angeles spends enormous sums to house people experiencing homelessness, and every year residents ask 2 questions that rarely get a straight answer: how much is this actually costing us as taxpayers and are the intended recipients receiving it? This article aims to answer both in plain language that anyone can understand using facts from the government's own reporting.
Official budgets are hundreds of pages of line items, fund transfers, and acronyms that are nearly impossible for an ordinary taxpayer to follow. This article takes the opposite approach. It uses one idea almost everyone already understands — a home mortgage — to show, in plain dollars and cents, what it costs to build and finance a single unit of housing, and what that adds up to across the county's homeless population. The answer to the second part of that question is a resounding NO and has been for AT LEAST the past 30 years.
How We Got The Numbers
The most expensive part of “permanent supportive housing” is building it. When a government builds an apartment for $700,000, that money does not appear out of thin air. It is borrowed — usually through government bonds — and paid back with interest over decades, exactly like a household paying off a mortgage. Therefore, the plainest way to show the real cost is to treat each housing unit the same way a bank would treat a home loan.
We used the average 2026 mortgage rate of 6.55% on a 30-year loan — the same terms a family buying a house would face today. The numbers we used are about the same as real world values. For each unit we calculated the monthly payment, subtracted a modest $300 monthly contribution from the resident, and the remainder is what the public covers. That remainder is the subsidy: the portion of the bill paid by taxpayers. Figures are rounded for readability and represent construction-financing costs only. It means that the true total cost is guaranteed to be much higher for reasons to be outlined below. Monthly payments use standard mortgage amortization at 6.55% over 360 months (30 years); the taxpayer subsidy equals the monthly payment minus a $300 resident contribution.
The Assumptions We Made
Good financial writing states its assumptions out loud so anyone can check or challenge them. Here are ours:
Interest rate and term: 6.55%, 30-year fixed — the going 2026 mortgage rate.
Resident contribution: $300 per month. Many residents receive SSI, disability, or other monthly benefits. This assumes a portion flows back toward the cost of their unit. It is deliberately optimistic — if residents pay less, the taxpayer share of the burden is larger.
LA County Homeless Population: roughly 74,000. The most recent Los Angeles County homeless count using LAHSA’s numbers.
One person per unit: A conservative basis for counting, keeping in mind that an apartment building complex can have multiple units inside of it.
Construction cost tiers: $60,000 is an efficient modular or manufactured target — what housing could cost if built cheaply and includes things like container homes which LA and elsewhere promised to build to; $700,000 is a documented per-unit cost in the City of Los Angeles; $1,000,000 reflects the high end some projects have reached.
Construction financing only: These figures cover the cost of building and paying off the unit — nothing else.
What One Unit of Housing Costs
For a single person, in a single apartment, here is what the mortgage on the building works out to — and what taxpayers must pay after the resident's $300 share:
| Construction cost | Loan payment / month | Taxpayer subsidy / month | Per year | Over 30 years |
|---|---|---|---|---|
| $60,000 (efficient modular target) | $381 | $81 | $975 | $29,238 |
| $700,000 (documented L.A. cost) | $4,448 | $4,148 | $49,770 | $1,493,107 |
| $1,000,000 (high end seen in L.A.) | $6,354 | $6,054 | $72,643 | $2,179,295 |
Read it this way: at the $700,000 cost L.A. has actually documented, taxpayers subsidize roughly $4,148 every month — nearly $50,000 a year — to house one person. Over the 30-year life of the loan, that is about $1.5 million per person.
What It Costs Across Los Angeles County
Now multiply that single unit across the county's roughly 74,000 homeless residents:
| Construction cost | Subsidy / month | Subsidy / year | Over 30 years |
|---|---|---|---|
| $60,000 | $6.0 million | $72.1 million | $2.16 billion |
| $700,000 | $306.9 million | $3.68 billion | $110.5 billion |
| $1,000,000 | $448.0 million | $5.38 billion | $161.3 billion |
Read it this way: housing everyone at the documented $700,000 cost would commit taxpayers to about $3.68 billion every year, and roughly $110 billion over 30 years — for construction financing alone.
What These Numbers Do Not Include
This is deliberately a floor, not a ceiling. The figures above cover only the cost of building and financing the housing. They leave out land where it is not already bundled into the construction price, ongoing operations and maintenance, utilities, on-site staffing and security, and the supportive services — case management, mental-health and addiction care — that give “supportive housing” its name. Those recurring costs can exceed the cost of the building itself. In other words, the true, all-in number is much higher than what is shown here.
The Bottom Line
It is not the fault of the homeless that the housing crisis exists. It is not the homeless
Even on the most conservative, construction-only basis, the arithmetic is sobering. Building a single $700,000 apartment and financing it like a mortgage costs the public about $1.5 million per person over 30 years. Spread across the county - the commitment climbs into the hundreds of billions. These are not exotic calculations. They are the same numbers any homeowner sees on a loan statement, now applied to public spending.
To be clear: the point is not that housing people has no value. The point is that when residents are handed a number, they should be able to check it themselves — and decide for themselves whether their money is being spent wisely and in the intended manner.
Part 2 - Cost Gap Explained in Ratios and Pictures
The tables in the first part answered a simple question: what does a unit of housing cost? This part answers a second one — how do those costs compare to each other? Every figure below is derived only from the numbers already shown, placing special attention to the hidden ratios that are often easily overlooked because they are hidden within the totals.
The Numbers Behind the Numbers
Here is the same data, turned into the comparisons that matter to a taxpayer:
| Derived metric | Documented typical cost of construction ($700,000) | Documented high-end cost of construction ($1,000,000) |
|---|---|---|
| Cost multiple vs. $60k benchmark | 11.7× | 16.7× |
| Percent more expensive than benchmark | 1,067% | 1,567% |
| Efficient units foregone (1 unit = ?) | ≈11.7 | ≈16.7 |
| Resident's $300 as share of payment | 6.7% | 4.7% |
| Taxpayer share of the payment | 93.3% | 95.3% |
| Taxpayer 30-yr cost per person | $1,493,107 | $2,179,296 |
| as a multiple of the benchmark subsidy | 51× | 74× |
| Excess over benchmark, per person (30 yr) | $1.46M | $2.15M |
| Excess over benchmark, aggregate (30 yr) | $108.3B | $159.1B |
Read it this way: building at the documented $700,000 L.A. cost is nearly twelve times the price of an efficient unit — but because of a quirk explained next, it costs taxpayers fifty-one times as much.
Costs the Assumed $300 Monthly Payments from Residents Hides
The resident's contribution is a fixed dollar amount — $300 a month — not a percentage. That single fact changes everything. On a cheap unit, $300 covers most of the monthly cost, so the taxpayer's share is small. On an expensive unit, that same $300 barely dents the bill, causing the entire cost burden landing on the public.
The result is that the taxpayer's burden grows far faster than the price of the building. A $700,000 unit costs 11.7 times more to build than a $60,000 one — but it costs taxpayers 51 times more over 30 years. The $1,000,000 unit reaches 74 times. The chart below shows the per-person totals side by side.
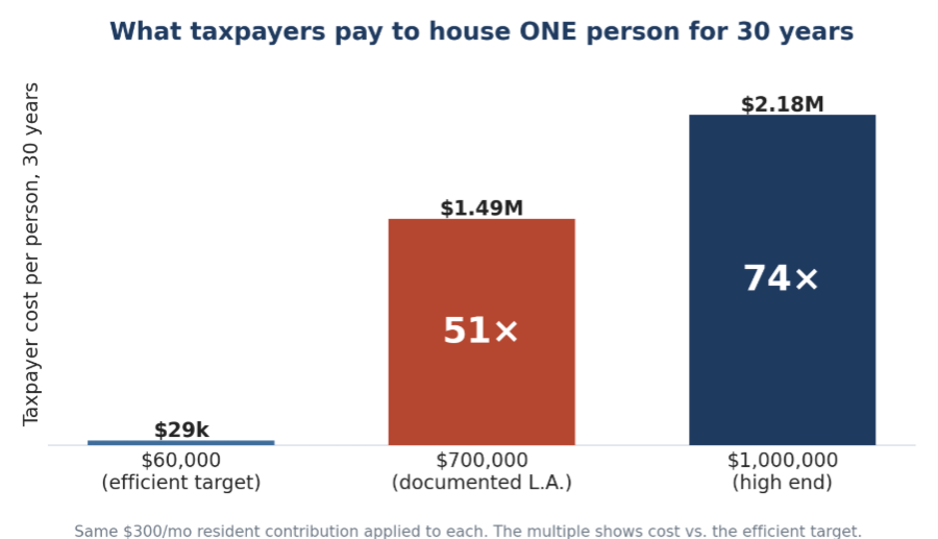
Los Angeles taxpayer cost to house one person for 30 years.
The multiple inside each bar is the cost relative to the efficient $60,000 target.
Where Every Dollar Goes
Split a single unit's price into two parts: the amount that matches what an efficient unit costs, and everything above that. At $700,000, only about 9 cents of every dollar matches the efficient benchmark. The other 91 cents is spent above it.
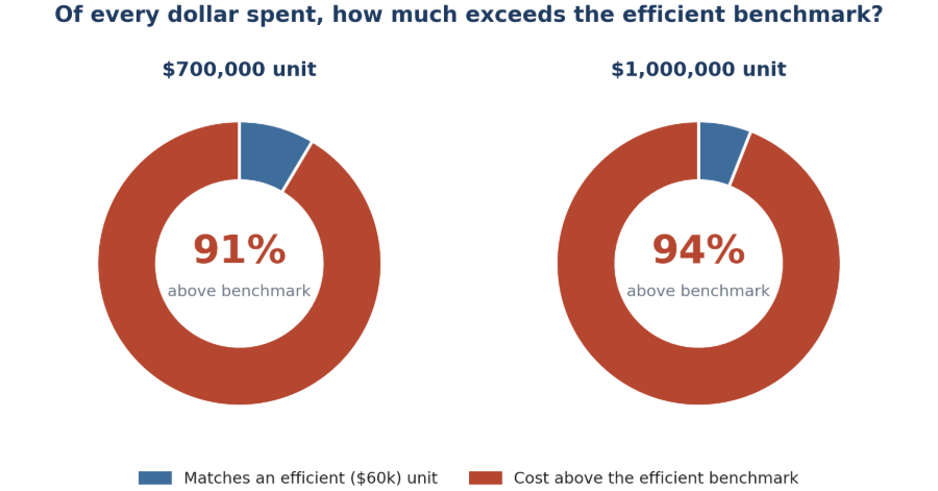
Percentage of many dollars spent exceed efficient housing benchmark.
The blue slice is the efficient-unit cost; the red is everything spent above it. This is the size of the gap — not, by itself, proof of where the money went. Where the money went is discussed at the end of this article.
The Vanishing Resident Monthly Payment Share
The same story, now told as proportions. As the cost of the unit rises, the resident's fixed $300 shrinks from covering most of the bill to covering almost none of it — and the taxpayer picks up the rest, through no real fault of the resident.
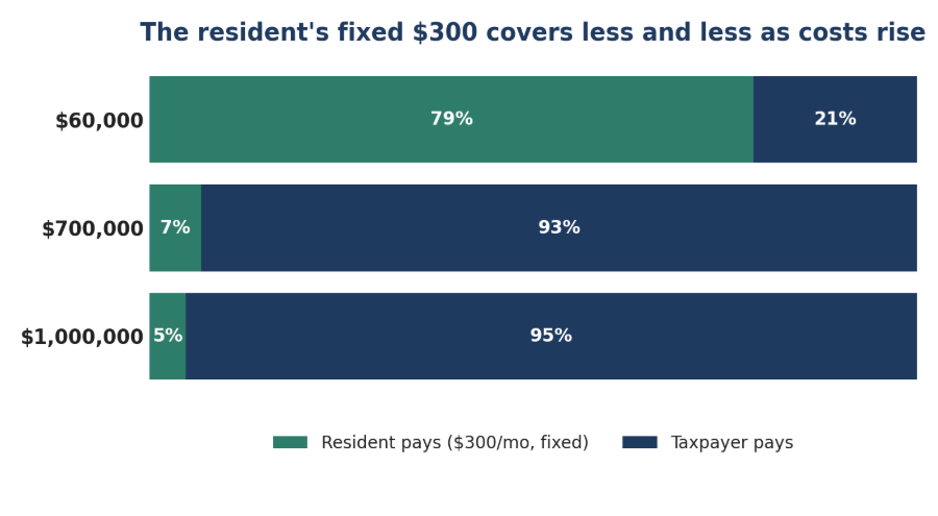
Who pays the monthly tax bill portioned by unit cost.
The green resident share collapses from 79% to under 5% as the price climbs.
What the Same Amount of Money Could Have Built
Perhaps the most intuitive way to see the gap: for the price of one apartment built at the documented $700,000 cost, nearly twelve units could have been built at the efficient $60,000 target. At the $1,000,000 high end, it is almost seventeen.
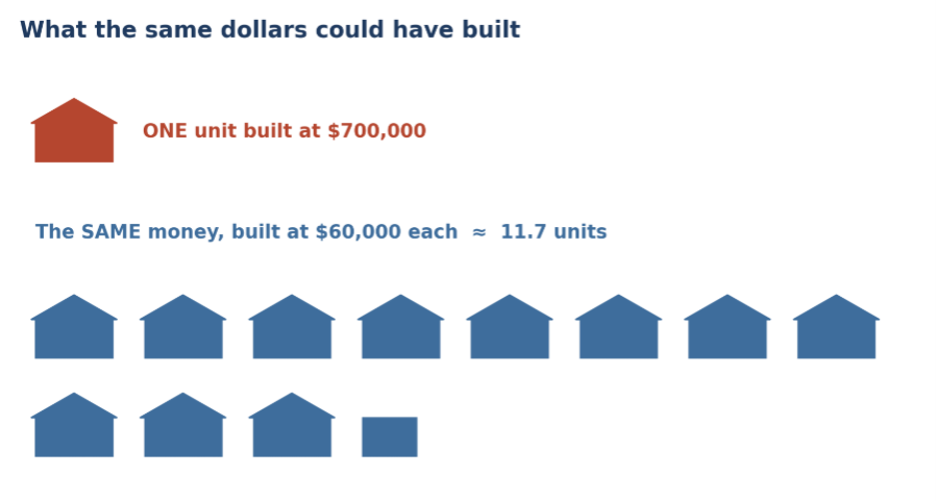
Comparison of quantity of homes capable of being built at two different prices.
The promised target cost of $60,000 per unit would allow for about 11.7 units to be built as a ratio when compared to the cost to build just a single unit at the documented average per-unit cost of $700,000.
The Cost of Corruption
These figures prove that a very large gap exists between what housing costs in Los Angeles and what it could cost if built efficiently as was promised from the get-go and still gets promised in political campaign rhetoric today — 91 cents of every dollar on a $700,000 unit is spent above the efficient benchmark, and across the county that gap runs to more than $108 billion over 30 years.
Some of these calculations reflect real and defensible costs — land, code and seismic requirements, prevailing-wage labor, and financing. The overwhelming majority, however, reflect fraud, waste, and abuse.
The gap of this size in the true documented efficient building versus real documented costs is the cost of corruption. This is the type of calculation that is often self-explanatory but never truly depicted on a line-by-line accounting of where those 91 cents on the dollar actually go. When one option costs more than eleven times another to build and fifty-one times as much to subsidize, the burden of explanation belongs to the people spending the money.
Part 3 - The Los Angeles County Scale View
The visuals in Part II all describe a single unit, a single person, or a single dollar at just the City of Los Angeles level. This section shows the two dimensions a taxpayer wants to feel: the total size of the bill across the whole county of Los Angeles and how that bill accumulates over time. Below is a table reiterating the values that we have already discussed.
| Figure | What it shows | Metric basis |
|---|---|---|
| 1 (Part II) | Taxpayer cost to house one person, 30 yrs | Per person |
| 2 (Part II) | Benchmark vs. excess share of each dollar | Per dollar |
| 3 (Part II) | Resident vs. taxpayer share of payment | Proportion |
| 4 (Part II) | Units foregone (1 vs. ~11.7) | Per unit |
| 5 (new) | County-wide total 30-year burden | Aggregate / county |
| 6 (new) | Cumulative cost over 30 years | Time series |
The Los Angeles County-Wide Bill
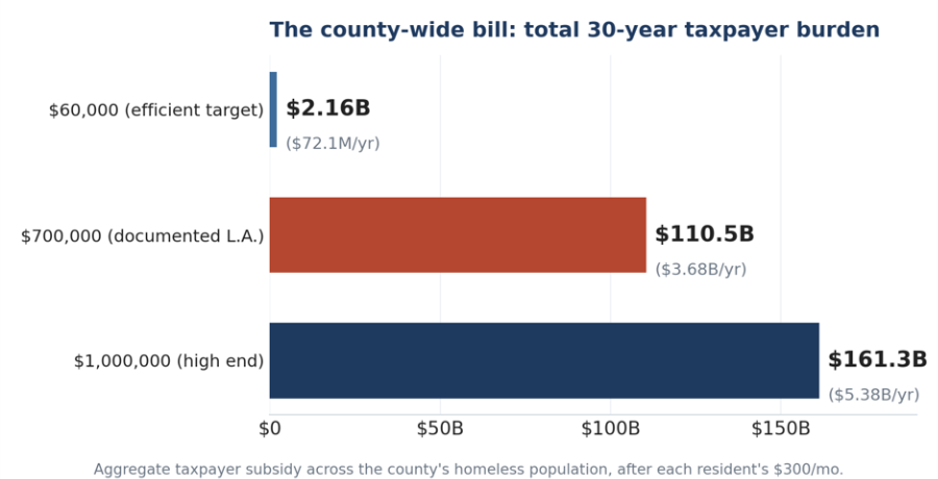
Figure 1 answered “what does it cost to house one person?” This is its collective counterpart: what it costs to house the county's entire homeless population of roughly 74,000. The efficient target barely registers on the same scale at which the documented and high-end costs climb into the hundreds of billions.
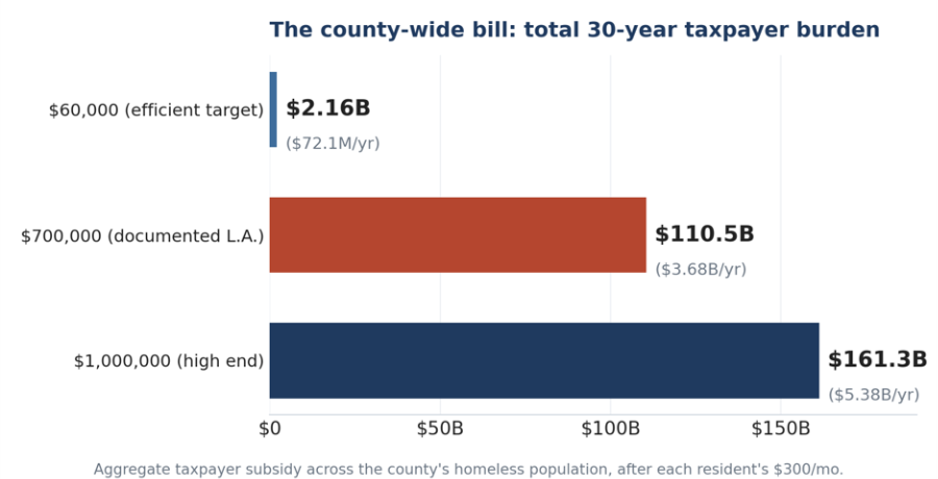
Aggregate 30-year taxpayer subsidy by construction cost.
Annual figure shown in parentheses. At the documented $700,000 cost, the county bill reaches $110.5 billion.
Read it this way: moving from the efficient target to the documented cost multiplies the county's obligation from about $2.2 billion to $110.5 billion — the same population, housed at a different price.
The 30-Year Cost Accrual Window
Costs do not arrive all at once; they accrue year after year. This figure plots the running county total from the first year to the thirtieth. The steepness of each line is that tier's annual cost, and the point where it lands at year 30 is the cumulative total. The distance between the lines is the price of the choice, widening every single year.
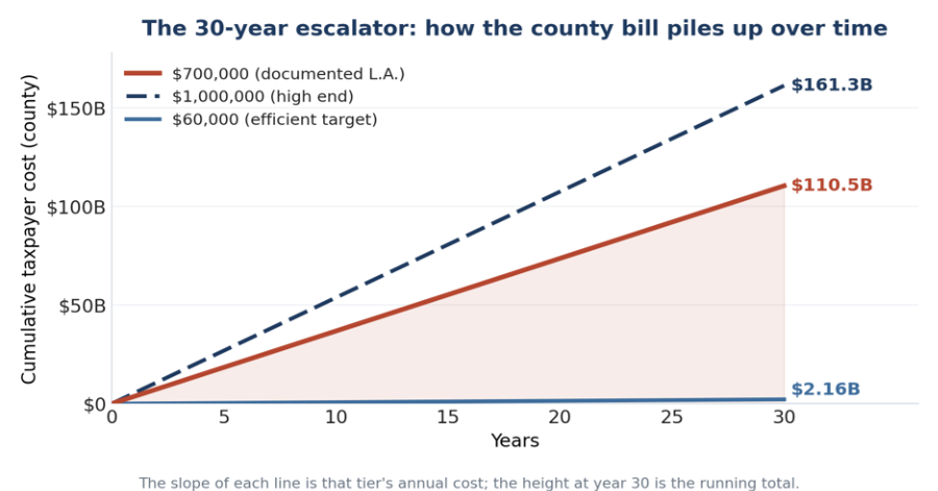
Cumulative Los Angeles county taxpayer cost over 30 years.
The documented $700,000 path (shaded) reaches $110.5 billion; the efficient path stays near the axis.
Read it this way: the gap is not a one-time figure but a widening spread — by year 30 the documented path sits roughly $108 billion above the efficient one, a distance that grew with each year that passed.
A Partial Solution and Path Forward
The numbers we ran are just for Los Angeles, but this fraud, waste, and abuse is occurring everywhere, nationally and internationally, for at least as long as in Los Angeles. New York City, Chicago, Boston, and Seattle just so happen to be some of America's largest economic hubs that make it easy to highlight the sheer magnitude of this fraud to drive the point across but the issue is not isolated to just a Republican or Democratic one.
Corruption at this scale spanning this many decades and multiple administrations, with a proven track record of overt & covert criminal collusion between our government, bankers, corporations, and foreign entities is not an issue that We The People can simply "vote ourselves out of". It shows a pattern and practice of deliberate malice willfully orchestrating horrific conditions to ingratiate a few with more power and wealth, with zero end in sight because nothing could ever satisfy a predator's psychology.
Humans since time immemorial have warned against predators, despotism and tyranny, including America's founding fathers. Fraud, waste, and abuse will always exist, and every government has always and will always inevitably turn against its people. Recorded history has been proven as such. The propensity for villainy is inherent in humans; it is a permanent perpetual reality. The only way to civilly combat against it and be successful is to enact lasting societal structures that screen out the various mechanisms of tyranny, including but not limited to concentrating a majority voting block control via a duopoly.
The republic system of government that America has under its constitution has proven itself superior over parliamentary government due to its long-term stability. My position is to keep that same republic but implement some much-needed interlocking updates, at least the four as outlined below, along with restoring citizen-led criminal prosecutions of government officials and corporations.
Ranked-Choice Voting (RCV): Replaces First-Past-The-Post method for elections, eliminating the “spoiler effect” fear forced onto voters against their will, which guaranteed wasted votes along with forcing a decision between “lesser of two evils”.
Abolishing the Electoral College & Adopting a National Popular Vote for Federal Government: Ensures every individual vote carries equal weight nationwide, ending the swing-state monopoly.
Nonpartisan Top-Four (or Top-Five) Open Primaries: All candidates run on one primary ballot regardless of party. The top vote-getters advance to the general election, stripping party bosses of gatekeeping power.
Equal National Ballot Access: Establishes a uniform, lower signature threshold for national candidates, removing the 50 distinct state-level bureaucratic hurdles.
This core incentive shift covers the weaknesses of each individual reform by accomplishing the following:
No More Safe Harbor in Party Labels: Candidates can't just slap a "D" or "R" next to their name and coast through a safe district on tribal loyalty alone. Without closed party primaries, they must appeal to the broader electorate from day one rather than pandering to the most extreme partisan base.
Negative Campaigning Becomes Statistically Dangerous: In First-Past-The-Post, destroying your rival's reputation helps you directly by suppressing their turnout. In Ranked-Choice Voting, if you launch scorched-earth attacks against a rival candidate, you alienate that candidate's supporters—guaranteeing they won't list you as their #2 or #3 backup choice. Candidates are incentivized to campaign constructively to earn second-preference votes.
Competing on Performance, Not Fear: Because voters aren't terrified of "wasting" their vote on an independent or third-party candidate, incumbents are held accountable to what they accomplished in office rather than relying on voters settling for them out of fear of the alternative.
Coupling these incentive shifts along with the oversight mechanisms discussed in our prior coverage of the homeless fraud in Los Angeles significantly reduces the chances of total tyranny and despotism that America has suffered particularly as of late, as well as guaranteeing a pressure relief valve for We The People to resume control in the inevitable event that government turns on We The People.
The duopoly America has, which really at the end of the day is just the uni-party ingratiating itself on the planet's wealthiest population and tax base in comparison, has proven itself to be a total failure at stopping institutional corruption. Purist States on both the Republican and Democratic sides have a proven track record of protecting and putting the Party along with their cronies above the needs of We The People. California, Texas, Florida, and New York are proving grounds that have allowed this institutional corruption to run amok for decades despite having an armada of enforcement mechanisms to stop and prevent future abuse. The LA Alliance and Valentini homeless veterans case against the VA have repeatedly proven as such in a court of law.
The proposed governance shifts would then help make way for further relief: increased spending in K-12 public education along with eventual free college, more investment in public research institutions like NASA, free public healthcare for all, and stronger oversight mechanisms.
The shift won't be easy but if We The People truly want to have a chance at an equitable and prosperous future for all built on secular reason with peace, like that depicted in the original 1960s Star Trek, then critical civil discourse must be held publicly on this issue with the cold facts laid out here and in our previous article.